![[object Object]](https://images.prismic.io/researchsquare/5993d77f-4aa5-44b0-9ea3-e7e67445c002_Types-of-Data-Classification-banner.png?auto=compress,format&rect=0,40,600,400&w=600&h=400)
Data is the main driver of today’s research. ”Data” actually means different types of information which can be stored and used as a reference for the research.
There are many ways information can be stored as data. To be able to effectively analyze data, we must understand the data types which have specific characteristics and principles of use in research. A concept called “classifying data” is discussed further in this article.
Different data types are often not fully understood by researchers. This can cause a lot of problems and limit the research potential for publications and projects. In this article classifying different types of data, what these classes or data types represent and how they can be used in Research are discussed.
Numerical data
When we say “data”, most researchers will think “numbers”. But this is only one type of data in a large pool. With numbers, we can quantify, which makes them very important.
Numbers are the most abundant form of data in research. They are used to describe samples, measurements and compare different taxa. Numerical data is also used to present results in research. Means, standard errors, medians, risk, frequency and many more metrics used to present results are mostly in numerical form.
Numerical measurements can be organized in rows (horizontal) and columns (vertical) such as a table structure in software like Microsoft Excel and other spreadsheet programs.
Numerical tables can store the needed numerical information in an organized way. Researchers can easily compare the quantities being represented in the table.
But numbers can have different forms. There are two types of numbers used to create numerical data. Those number types are called integers and rational numbers.
Look at the example of a numerical table for air quality and ozone radiation in Figure 1 below. It contains variables “Ozone”, “Solar.R”, “Wind”, Temp, “Month”, and Day. These variables are actually numerical columns of measurements for different characteristics of air quality.
Variable “Day” is an integer. It does not have decimal places and is a whole number.
On the other hand, the variable “Wind” has decimals and is a rational number.
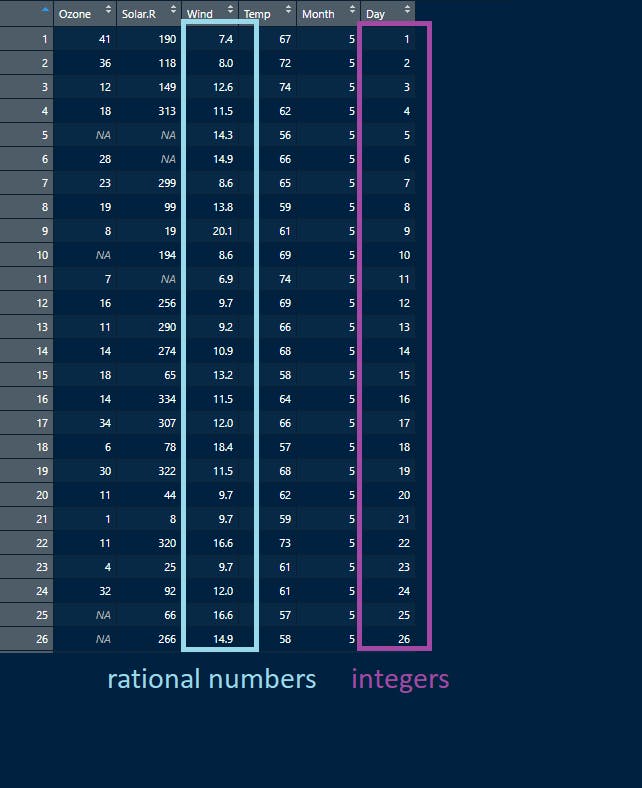
Source - air quality dataset: Chambers et al (1983). Graphical Methods for Data Analysis
Let's discuss integers and rational numerical data further. As you can see, numerical data most often has one of the following forms:
1. Integers
These are whole numbers representing non-divisible units of measurement, like in the example above, Day 1, Day 2, Day 3 or counts of 55, 56, 57. Integers do not contain decimal places. They are whole numbers. Typically, they are used to store data about observations which can not be divided further than whole numbers.
2. Rational numbers
These numerical data are divisible to smaller units of measurement. They are equivalent to ratios of integers. They are called rational numbers (eg . ¼ is a 0.25 rational number). Their characteristic is having decimal places as seen in the image above. If measurements and observations can be divided into smaller and smaller fractions, this provides a more accurate scale for measurements. These scales are often called continuous scales. The data itself is continuous data.
One example of continuous data is height. Height can be presented as 180.1324 cm or 185.4367. Weight can be presented as 70.4366 kg or 65.0001 kg. Since four decimal places were added, the data will provide a more detailed and more accurate measurement.
There are other classes of numerical data like natural numbers, real numbers,
irrational numbers, etc, but the two most frequent forms used in research are integers and rational numbers.
Characters (text/strings)
Another type of data present almost everywhere in research are characters. Sometimes we need to give names to certain taxa, or add other category names for certain observations. These names are actually sequences of letters. They represent a certain qualitative observation. In other words, we cannot quantify a name, but the name can represent a certain qualitative observation. These variables are called nominal variables.
Text
A text file is another type of character-based data. It can be used for many translation and natural language processing sciences.
Text can also contain numbers; it may be used as a data file which stores both numerical and character data.
Even though we can better quantify observations and measurements with numerical data, the character data is better for creating and processing sequences. These sequences are just simply sequences of characters. Large amounts of sequence data can be stored in small text files and analyzed further.
One such example is the use of text sequences in bioinformatics.
Genetic information contained in DNA in living organisms is coded as 4 nucleotides, A-adenine, T-thymine, C-cytosine and G-guanine. It can be coded as ATCG. Sequences of these letters represent the nucleotides.
Here is an example of human insulin sequence:
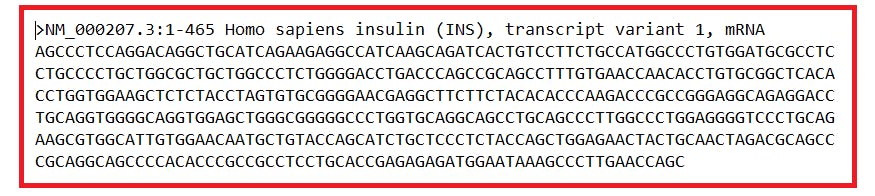
Source : NCBI - National Center for Biotechnology Information
It is a sequence of letters (ATCG) as mentioned before. It represents a genetic sequence which is transcribed from DNA to mRNA (messenger ribonucleic acid) during a process of DNA transcription.
Sometimes, taxa or categories in data can be best described logically by their names.
Example: Different flower taxa can be marked with the species name and would represent categorical data, or sometimes called in statistics, factors or levels. It’s common to have both numeric and factor (character marked) data for different taxa.
Here is another example where data might contain both numeric and character data:
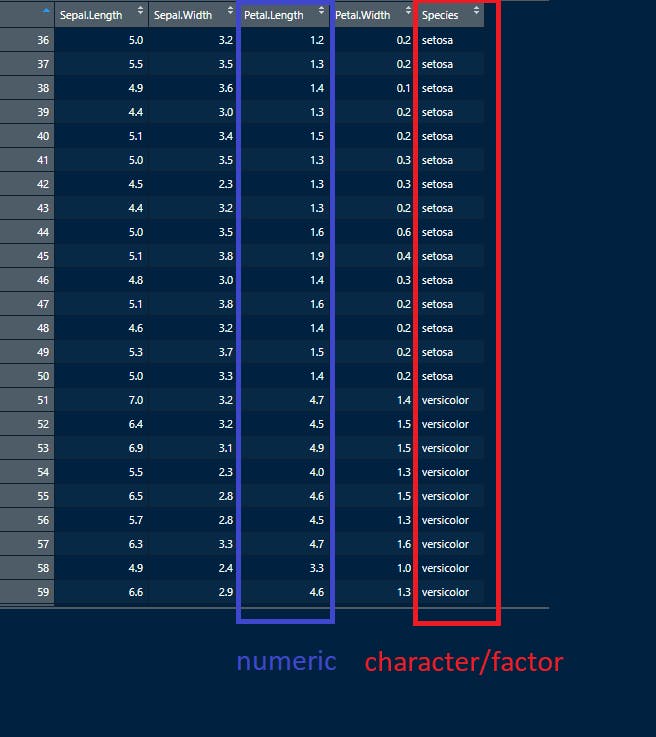
(Source - Iris dataset by Anderson, 1936)
Numeric columns from the “iris” dataset are accompanied by the last column containing names (characters seen as setosa and versicolor). But these are also factors. We can call them species factors because data for different species might be checked for differences.
Audio data
Audio data is not frequently mentioned in discussions. It’s very important for many research areas. Ornithology is one example where researchers often study audio files of bird sounds to examine their communication, identify their biological life patterns, and identify species based on their audio data.
Audio data is specific because it can be used to identify research patterns with high accuracy.
Pixel based data (images and videos)
Images are a specific type of data which contain visual information about the research item. In radiology MRI scans, ultrasound images (among other types of image based scans) reveal biomedical information to doctors and researchers.
Additionally, many types of images can be used in AI research. Image data is composed of specific small segments called pixels. These pixels store information about color and space. Combined, millions of tiny pixels form images that we can easily interpret and use for scientific observation.
In research, images are very informative, but also very intuitive. They enable readers to get a more realistic perspective on the research problems and analysis results. One of the best approaches in presenting research results is combining detailed numerical data with images to produce a more complete perspective for readers.
![]()
(Photo by Dr. Mae Melvin, USCDCP on Pixnio)
An image can represent and store valuable data about an observation. In the above example, different types of blood cells can be further analyzed by microbiology researchers. Thousands of images like this can be stored in databases and hold valuable information about the microbiology of humans and other organisms.
Images can be used to derive numerical data in both quantitative (numerical) and qualitative (categorical form). An observation from an image can provide a high level of details for other data types. Video data is an extension of image data where pixels can change through time. Videos can be very useful to track changes in an experiment over different time periods. Experiments can often take a lot of time. Video data enables researchers to track the course of the experiment without losing relevant information.
Final thoughts
Remember, for any research project, classifying data is important for multiple reasons:
- We must make sure the right class of the data is present and able to answer the research questions.
- The right class of the data also enables the validation of the data.
- Methods in the research analytics often require a specific data class.
Additionally, high quality research projects generally have meta-data which explains the context around the data. In this section, it’s important to define which data classes were used for research purposes. This is very important from research reproducibility and data validation.